Saturday, 30 June 2018

Otago Central Railway [63J]: Ranfurly-Alexandra 10 (Omakau-Lauder 3)

Due to being busy with a few other things there hasn't been much done on the Otago Central rail maps lately. I'm working on Lauder again but the mosaic still needs some work before I can actually use it. The interim version of Lauder is below.

As you can see there is improved image quality in this 1965 aerial photo which has been the main goal of reworking the aerial mosaics.

But as I noted above this mosaic has to be done again because of misalignment of the tracks. There is always going to be some kind of alignment issue because of the inherent nature of aerial photography, but the tracks on the ground have to line up, because flat features on the ground over a short distance with minimal altitude change are the least affected by variances in un-orthorectified imagery, and so it's reasonable to use these features as the alignment baseline.

As a result I need a few hours (probably early next week) to correct the mosaic and then bring in new map tiles to the GIS, realign the map features, and then produce the final versions of the maps. So there will be one more post about Lauder when those maps are completed.

And then the next station to be looked at is Auripo. It will be interesting to see if LGGA have scanned the only available survey of a good resolution, Survey 112, yet. If they haven't, I have some ANZ track diagrams I can put into a mosaic to trace off, and then some other low resolution aerials to use in the mosaics for the final maps.

Thursday, 28 June 2018

PNGL Maps Update [1]

As I have mentioned on other posts recently I am working towards re-issuing the existing map diagrams for a number of areas where they were available in the past, but have not been online since changing over to Google Photos as a display system.One of the map sections which I am looking to re-issue in the near future is the Palmerston North Gisborne Line. Since part of the closed section is being re-opened it is time to update the maps for Napier-Wairoa. There was a published part volume for the Napier-Gisborne section which is not being updated or republished at this stage, since volumes like this are part of the full production process that incorporates the overall revision of map data using aerial photography, and there is no immediate timetable for the total revision of the Volume 5 content or the publication of rail maps for the section.

So there will soon be a new set of map diagrams for the entire PNGL using the updated template mentioned in the previous posts and designed to facilitate being downloaded and used offline with an electronic device such as when used in the field.

The map project for the PNGL beyond 82 km, which is the boundary between Wairarapa and Hawkes Bay, is being updated to the latest data standards. All of the map data shapefiles have been converted into the new GeoPackage data format. All of the terrain GeoTiffs have been reprojected as EPSG:3857 so that there is no need to have on the fly reprojection of any older EPSG:4326 layers. The data tables for all relevant layers are having the generational fields (yearIns, yearDel) and other useful fields (comment, customFlag) added to them as has been already undertaken with most of the other map projects to date. The layout template for 16:9 format maps will be updated to add the navigational markers for use when swiping between maps on an electronic device as mentioned previously.

Expect to see some output either from this project or some other aspect of maps in the next few days but things have slowed down in the last week or two due to family matters and other considerations.

Tuesday, 26 June 2018

Map production update

People who have been following this project for a while know that we did issue map collections for a considerable portion of New Zealand when we were using Flickr to store these collections. As a result of the reorganisation of NZ Rail Maps resources when the website was set up, the Flickr collections were taken down and replaced by Google Photos albums.

Since that was carried out, the previously generated map collections have, for the greater part, not been republished in Google Photos to date. We are now planning to re-issue the previous maps (diagrams as we now call them) for as many lines as they are currently completed for. These will be published to the latest template standard but the map data in them will be largely unchanged. However where addition of new data has been partly completed a decision will be made on whether to republish as is or complete the addition of new data before republishing.

The current project for updating the maps is largely focused in two areas:
  • Tracing over current Linz aerial photography, and using that as a map background
  • Adding additional content to the maps from historical aerial photos and using these photos as map background.
This work will be ongoing. The first step is relatively straightforward in mapping but does require significant preparation in downloading and selecting the aerial photos needed as a background for a particular volume of map production. The second step is more time consuming as georeferenced mosaics have to be created for a particular location of a route (such as a station, yard or depot) and then traced over with the additional detail added in a way that makes it possible to publish multi generational maps for the specific location. Hence the update aspect of the project is slower in terms of the publishing of content.

Map volumes will be published for each volume as the aerial photo based maps are completed for the entire volume. There are twelve volumes whose content is listed on the home page of our website. Some of these volumes have been published over the last four years, mostly as diagrams. The Nelson volume which has been published more recently uses aerial photo backgrounds as an experiment. 

There are two main types of published content for the maps. These are:
  • Rail Maps - these show the map data published over a background of current and historical aerial photography. They are most suitable for use with electronic devices where the full colour of the aerial photographs can be viewed without limitations.
  • Map Diagrams - these show the map data with a plain white background. Diagrams are ideal for use where there is a need to have a physical format such as by printing individual maps that are downloaded off the web or by printing out one of the map volumes that are produced for a particular group of routes.
As noted above we have experimented with using both formats in map volumes. However, the intention when producing map volumes has historically been geared towards a printed solution for those users that wish to have a physical variant of the maps. The aerial photo background used in the recent Nelson volume is really only of use when viewing it on an electronic device and the volume format in a PDF file is sub-optimal for field navigation because of the layout of individual pages that frequently contain multiple maps for efficient use of space. The use of colour content in the maps is also contrarian to easy and cheap printing as the colours will not always reproduce well in black and white printing or copying, and colour printing is often too expensive for many people. Hence, we expect that map volumes produced in future will all be based on diagrams.

Rail maps are currently published using Google Photos. We have discovered that it is possible to download a complete Google Photos album as a zip file to a device. For field use, this is the optimal solution and the photos in each album will be named in a numerical series that makes it easy for them to be browsed using a picture viewer that relies on alphanumeric sorting of the images. As previously described in the last post about field testing, the banner that has been added to the top of the more recently produced maps will have directional labels added to it to make it easier to navigate with a collection of maps on an electronic device, whether online or offline.

Monday, 25 June 2018

Field testing maps

This week we've had a bit of a field test of the maps just to evaluate some of the different ways they potentially could be used. Having been both on and off net over the course of a 2000 km trip, and travelling by road most of the time, we've had a bit of a think about some of the practical aspects of using maps.

These days with electronic handheld devices, one of which is being used to write this post, there is a great deal of inbuilt adaptability and convenience. Online platforms have transformed navigation for travel, but require a large and expensive web based infrastructure to provide the user interface for the platform. 

This project works on the assumption that people can still print maps out onto paper and carry a physical volume or medium along with them. As we all know the online platforms have little usefulness when out of mobile coverage areas, as is the case in significant areas of New Zealand.

Whilst retaining the focus on a format that is designed with physical media in mind, some effort will be expended on seeing if we can find ways to make the maps easier to use on a handheld device such as a tablet. The main issue is making the switching from page to page easy and intuitive to the greatest possible extent, given that rotation of a physical device is possible to orient the map the correct way up - just as with a physical map - and that there is then a desirability to have indications of which way to swipe between pages.

Tuesday, 19 June 2018

North Island Main Trunk [5]: Wellington Station 2


These three views are the same area of Wellington station yard. From 1900, 1938 and 2014. The turntable nearer Thorndon Quay was the one used by the WMR at its depot site.

Monday, 18 June 2018

Otago Central Railway [63I]: Ranfurly-Alexandra 9 (Omakau-Lauder 2)

As I wrote in my last post I am currently updating the map of Lauder station. 

These two images are respectively 1938 and 1965 images of Lauder. There is no apparent change in the layout of Lauder between these two periods.

At this stage there are no plans to extend the masking as I am unaware of any additional area that would benefit from being displayed in a part tile export.

The main improvement in this map will be the sharper 1965 aerial imagery due to having reduced the number of transform steps to the historical layer to one.


Saturday, 16 June 2018

North Island Main Trunk [4]: Wellington Station History

While I am at this very moment creating the map tiles (and will have them finished tonight) for the Tawa end of Johnsonville-Tawa, here is some detail of the history of Wellington Station as depicted on a map. (The tiles for J-T at the Tawa end have taken longer to create not because of the usual size problems with the mosaic, but because of having to work around a bug that crashed Gimp repeatedly until I figured out how to work around it. This lost me about a day. By contrast when it has taken so many hours to export tiles out of the mosaic, this part is proceeding extremely quickly, so much so that the tiles will be finished in a matter of hours rather than days. I may even be able to reconsider having to have a computer with 32 GB of RAM to process the mosaics because 16 GB may prove to be sufficient. I have to do some more testing to try to determine exactly where the resource constraint issues are occurring in Gimp because it seems that is the issue, not the images I am working with.

So WCC has on the Koordinates website some maps of Wellington Central from 1900 made by someone called Thomas Ward and they have a lot of detail about what Wellington used to look like because they have the tracks and structures in the old Wellington railway yard. So this has given me the detail I needed to place the old Thorndon and Lambton railway stations as well as some other detail that will be drawn into the maps in due course as I work my way through the current and historic layouts of the yard.

Here are some renders from the current and historic imagery of Wellington railway yards.


The main part of the modern passenger station and the historic Lambton station which was the NZR passenger station for trains going through the Wairarapa and over the Rimutaka Incline to join the NIMT such as it then was at Palmerston North (prior to 1908). Lambton ceased to exist after the new Wellington station opened in 1937 and this was at the same time as the Tawa Flat deviation came into operation bypassing the old WMR / NIMT line over the hills via Johnsonville.

The main line (NIMT) heading north out of Wellington in 1900 (it was still the WMR then) took quite a different route from the main lines now. Part of the reason for this was that the WMR had its own railway yards which the NZR main line had to clear.

WMR had its own separate station called Thorndon for their trains and after this was taken over by the government the station was used for trains on the NIMT via Johnsonville. The 1900 maps don't show the full layout of the WMR yards so I won't at this time be able to add the full detail, however aerial photos of Wellington yard from 1938 should make it possible to show some of the detail but this of course is post-WMR and as such the yard at that time was not a separate operation. Thorndon Esplanade as a roadway is interesting as it has all disappeared today under the railway and Aotea Quay.

The last two maps show how the main line as it then was headed north out of Wellington. I have had to trace the route shown on the last map and therefore have to assume for now that there really was that incredibly sharp curve just past what is now the motorway bridge to meet the existing alignment of the Johnsonville Branch as this was the WMR/NIMT. 

Friday, 15 June 2018

North Island Main Trunk [3]: Johnsonville-Tawa 3

Well time for another update on this section. The section of the deviation and former alignment at the Tawa end is covered by this post as I have spent the past few days completing the aerial photo mosaic for Tawa. It still has at this time to be masked and then turned into map tiles for Qgis which will take the rest of the weekend. That is not laborious hours of work. The masking is relatively quick (maybe a couple of hours) and straightforward to add. The slow part is the tiling as the computer will grind away at a snail's pace to capture the area of each tile and then render it into two separate files. Based on the previous experience with mosaics of this size (this one is 22 layers in total, which comes down to about 18 tiles, probably of which 15 will be rendered into maps), it can take 30 minutes per tile just because of the memory and disk demands on the computer. Here you can understand why I want a computer that has 32 GB of RAM, and probably 250 GB of SSD for buffering as well, because it will greatly speed up this task and mean I don't spend a whole day listening to the disk churning on the computer processing the aerials. That 30 minutes is mostly waiting time, so I can do something else while that is happening, but it is just the waiting that gets annoying. It explains why it took me three days to render the tiles out of the Johnsonville mosaic and some of the big ones I did for Christchurch already.

Anyhow here is some of the key aerial photography that has been used in this section.

Of particular note here are the horseshoe curves at what is now Takapu Road Exchange on the motorway. These curves are executed in order to lose a reasonable amount of height in a shorter longitudinal distance. Whilst I can't exactly pin down where this was in terms of the gradient diagram found in Ken Cassells' book (I have his one plus Douglas Hoyt's one to refer to as well), the ruling gradient of this area was 1 in 56. The gradients eased out somewhat upon reaching Tawa Flat, but did not really stop until Porirua. Assuming the part of the section from Tawa Flat to Porirua that was still in use after 1937 has not been changed since then, southbound trains leaving Porirua still have to undertake modest ascents at up to 1 in 150 gradients before they reach the southernmost end of the deviation. A major landmark above the Takapu Road overbridge which you can see on this map is what is now known as Arohata Prison, built in 1944 which is the same year as these aerials were taken.

In this map you have towards the left, the site of the old Tawa Flat station on the hillside above and  to the left of the present day Tawa station. Continuing towards the right the junction of the two sections of track can be observed.
This one is what you can download from ATL these days and it is Tawa at the time the motorway was under construction, therefore around 1951. The present day Tawa is right at the bottom of the image. The next three images are captures from the live version of this, zoomed in.
Here is a view down from Takapau Road towards Tawa. This area is mostly built on with housing between the motorway and the old railway.
Here at the bottom centre of this image is the old Tawa station and you can also see in particular Tawa Street crossing the deviation on a level crossing after having just crossed the stream via a bridge. Then you have Duncan Street between the old and  new railway lines, this was the route it then followed, before it was eventually straightened by taking over the old rail corridor
Finally we have the rail route down towards Tawa as it presently is, not visible because Duncan St had already taken over that part of the corridor north of the old Tawa Flat station. In the very bottom of the picture we can see the present Tawa station with its pedestrian overbridge and part of the platform. There is still an overbridge there today although modernised.

Otago Central Railway [63H]: Ranfurly-Alexandra 8 (Omakau-Lauder 1)

This is really just a quick catchup, because I haven't done much on this section over the past couple of weeks. Since the next station up the line from Omakau is Lauder, I need to start working on that. So far what I have covered is the Google Earth streetview of this section of the line. After that the work needed to be done is about the Lauder station map mosaic.

The current mosaic for Lauder is hereupon shown:
This one is based on a 1965 aerial image. Like many of the mosaics along the line, it was put together quickly in order to create some basic maps for the publication of the Observer article series. I now need to revisit and improve it for the final version of the maps.

What can be improved with the 1965 coverage is the quality of the map by redoing it with Gimp 2.10's unified transform in a single step, being vastly better than the multi step process I typically used previously when creating mosaics. In addition to this improvement, increasing the masking size to take in any additional area of interest is possible, although it is not clear that there may be any greater area at this stage.

The major change to this map will be to add a 1938 aerial photo to the map, although there appear to be no real differences from that era.

Whilst I have been busy working on other maps lately this one should be finished by the middle of next week so another map section can be finished off. I think it is possible the Otago Central maps to the standard that I am working them to should be completed by the end of this year.

Monday, 11 June 2018

North Island Main Trunk [2]: Johnsonville-Tawa 2

Time for a quick update on progress with this. I had hoped to be further along with this process but the work needed on the big aerial image mosaics (there is one with 17 layers for the Johnsonville end and a similar or bigger one for the Tawa end) took a very long time to finish just for the Johnsonville one which has finally been completed, because with an 8 GB image when compressed, decompressing and processing these results in a much bigger memory footprint. Since the computer with 16 GB struggles to cope with these layers I am considering upgrading a computer to 32 GB but that will cost $500 so is not going to happen anytime soon. Fortunately there are not too many mosaics that are that large.

There are two main historical mosaic images so far as shown below and the commentary attached to each one from Nicol Campbell which he supplied to me in 2002 and which I have been scrutinising ever since. These images have had to be downsampled because servers keep refusing to upload them at their original sizes although Flickr has accepted larger size versions than I can get to upload to Facebook or even Google Photos.


The commentary for this part reads as follows:
"As most of us know the Johnsonville on-ramp to the motorway follows the original line of railway north from Johnsonville. The old formation crossed what is now the motorway at a small angle and entered a cutting on the north side some 500 metres from the where the on-ramp joins the motorway proper. This cutting is still obvious although now choked with scrub and is blocked completely after 50 metres or so by fill used for road construction when the Paparangi sub-division was being developed."

Key points therefore: 
  • One of those curves that crosses over the motorway is a cutting part of which still exists - or did so in 2002.


This part incorporating the Belmont Viaduct includes the following commentary:
"The next obvious sign of the old right-of way are the two concrete abutments where the Belmont Viaduct once stood. The northern abutment is still easily seen but the southern one, now in a backyard, is vine covered and needs a little study to discern its location. In the gully the old concrete footings and some rusted ironwork can be found if one wishes to fight through the undergrowth. The right-of-way north from here can be discerned heading in a shallow curve towards a hill that once had a cutting running through to the motorway and was obvious until a few years ago when it too was filled for more development. The line then cuts across the motorway at a sharp angle and continues along its west side but slightly below road level. It is not continually visible from the motorway but because of the heavy earthworks needed in the hilly country the line can be easily traced on foot as it slowly descends through a succession of cuts and fills."

Key points:
  • Remains that can be found at the Belmont Viaduct site.

  • The northern approach onto the viaduct is in public park and part of the abutment and cutting still exists.
  • The line cuts across the motorway and on the far side there was a cutting part of which may still exist. Here is what this part looks like in Google Earth from the motorway.

Here is another photo of this area from when the motorway was first constructed:

So if one was to walk behind that hump there should be some cuttings in behind there.

  • There may be other cuttings and fills still in existence along this stretch of the motorway.


Wednesday, 6 June 2018

North Island Main Trunk [1]: Johnsonville-Tawa 1

The NIMT is not an area I was planning to work on in the near future but there has been an enquiry about this section of the former NIMT route, so I am taking a look at the maps I have of it. First thing is to download the LDS aerial photos of the area which are available in 0.1 metre resolution, and then start on mosaics of the route. Retrolens does have some aerial photography at relatively low resolution available from 1941-42. However about three years ago I paid Archives NZ to copy me some contact prints which are at a higher resolution, and date from 1944, so at the moment I am preferring to use these in the mosaics.

When I first started using historical aerial imagery I used to overlay it in Google Earth because that was what I was familiar with at the time. These days of course I use Gimp to produce something I can freely copy and reproduce and trace directly over in Qgis.

The aerial photos used to get overlaid onto GE. This example is at Takapu Road where there is now a major motorway interchange.
This is a Whites Aviation aerial of Takapu Road after the motorway was put through. Some of the railway route can still be seen, prior to the more recent residential development of much of this area.

The above two photos taken 1947 and 1951 both show the site of the old Tawa Flat station.

Tuesday, 5 June 2018

Midland Line [1C]: Otira-Greymouth 3: Otira 2

I just did an evaluation of aerial photography availability for everything west of Otira. The answer is that there is no suitable historical aerial photography to do maps with west of Otira.

The net outcome is there will not be detailed historical maps for the Midland Line beyond Otira, or the SNL in the near future. It will be a lower priority. I will however work on generating current maps using the LDS present day aerials.

Here are some aerials of Otira that were generated today. Good coverage also exists of Arthurs Pass and mosaics will be forthcoming sometime soon depending on priorities. ML coverage is going to be limited to Rolleston-Otira for the present.

The below are two series of three views, each series covers the west and east ends of Otira, and in sequence in each series the views are 1943, 1982 and 2014.


Particular changes that are seen over this period at the east end include:

  • The turntable was replaced by a turning triangle. The old turntable went to Reefton where it has recently been removed to be preserved by the Engine Shed group.
  • In 1943 the old coal fired powerhouse was still present in the turntable area, as the supply of power for the overhead and township had at that time only recently been changed to hydro electric power reticulated from Lake Coleridge in Canterbury.
  • The single road engine shed located next to the back leg of the turntable. This was still used until the end of steam, as engines were stabled and serviced at Otira for the changeover to/from electric traction.
  • The traction depot for stabling and servicing the electric locomotives was demolished more recently after the end of the electrification. 


Particular changes that are seen over this period at the west end include:
  • A lot of housing has gone in the 36 year period since the 1982 aerial was taken. Probably again this is largely since the end of electrification, and the village was mostly sold some years ago with one or two houses either retained or leased by KRL as there is still a small staffing requirement for operating the diesel banking engines for trains.
  • The yard sidings behind the station building have almost all gone. This area is now used to stable the banker locomotives that are coupled onto each train to take it through the Otira Tunnel which is a steeply graded 1 in 33 section of the Midland Line.
  • The village road level crossing at the Greymouth end of the yard has been moved further west. Probably the reason for this is to do with the change in track layout.
One of the most obvious visual changes of course relates to the end of electrification about 20 years ago. The gantries which carried the traction overhead catenary are all gone now.


Monday, 4 June 2018

Otago Central Railway [63G]: Ranfurly-Alexandra 7 (Chatto Creek-Omakau)

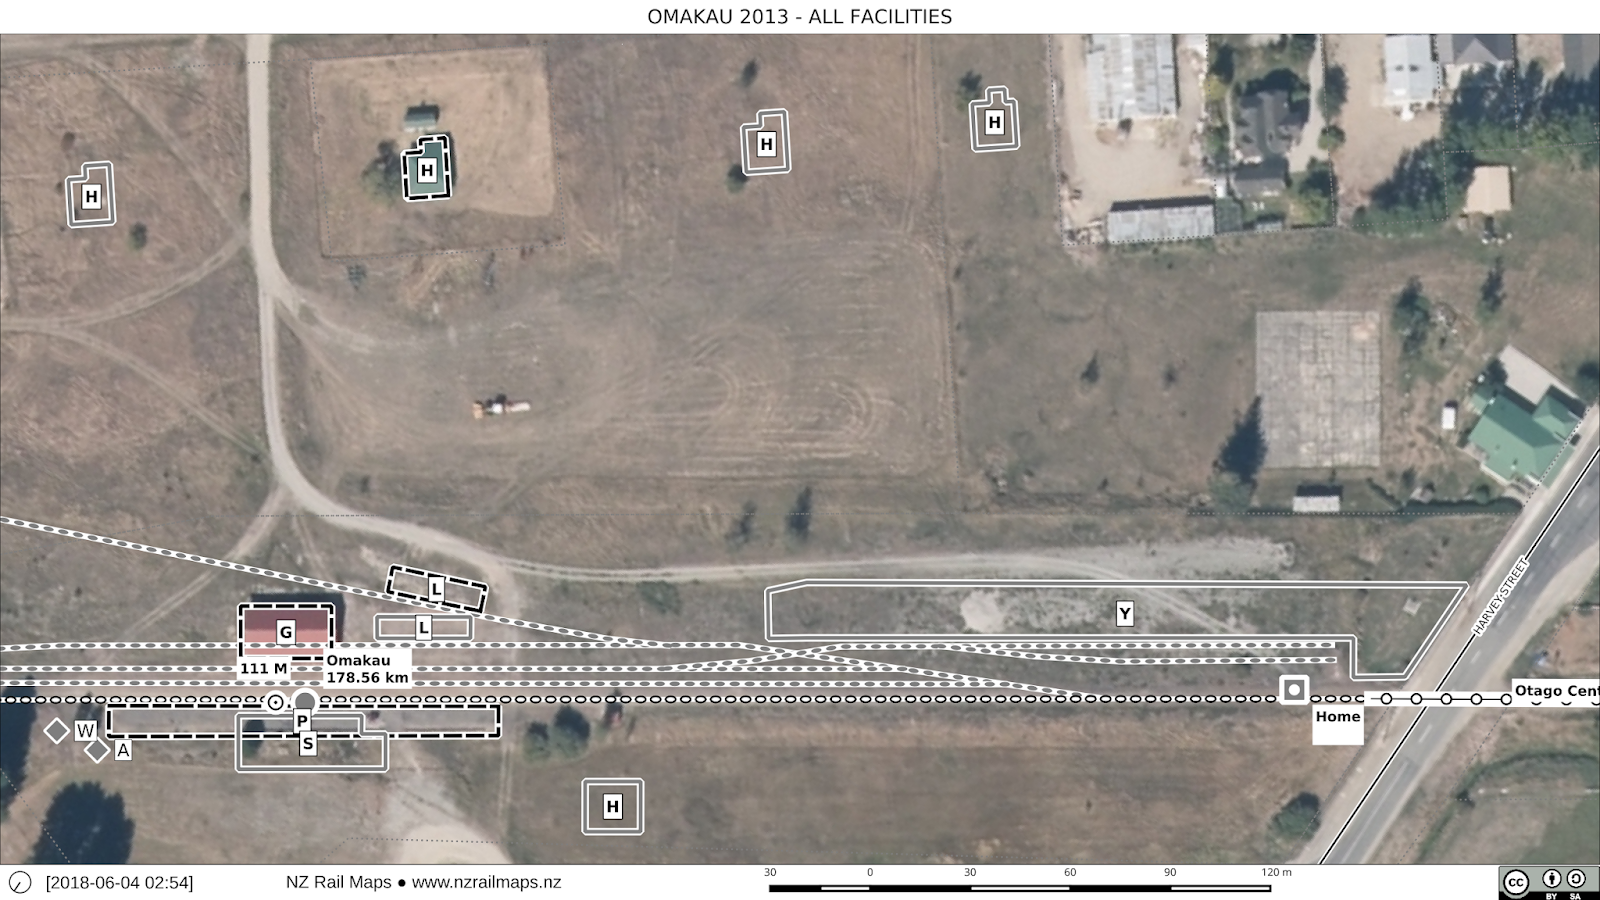
Here's the complete finalised map set for Omakau and a few Google pictures from along the way.


Bridge 74  just west of Omakau and the deep rock cutting at the west end of it.
Bridge 74A was added to the line in 1964 to eliminate a level crossing on State Highway 85, the site of which is seen below.

Aerial photo from 1938 of the old level crossing.
A view of Tiger Hill, the major topographical feature between Chatto Creek and Omakau. The railway descends and sweeps around, to pass along the foot of the range of hills seen to the right. 
An aerial view from Google Earth of this section of the railway. This highlights in particular how the Chatto Creek to Omakau section bypassed the deep Manuherikia River gorge to the right. The Manuherikia was followed by the railway from Lauder to Omakau and from Chatto Creek to Alexandra, hence the three large bridges that crossed this waterway.